Colleen Phillips' paper won an Emerging Leaders in Assessment Award at the 2016 APA Annual Convention.
Cite This ArticlePhillips, C. E. (2016, October 1). The Penn State Worry Inventory (PSWQ): A reliability generalization study. The Score. https://www.apadivisions.org/division-5/publications/score/2016/10/winning-paper
The APA Task Force on Statistical Inference (Wilkinson, 1999, p. 596) presented clear guidelines for researchers and clinicians: “Reliability is a property of the scores on a test for a particular population of examinees…Thus, authors should provide reliability coefficients of the scores for the data being analyzed even when the focus of their research is not psychometric ” (emphasis added). In response to frequent misunderstandings surrounding score reliability, Vacha-Haase (1998) developed Reliability Generalization as a meta-analysis of reliability coefficients reported in previous studies that have administered a Likert-type assessment measure.
The focus of this paper is the assessment of the reliability scores of an often cited measure. The Penn State Worry Questionnaire (PSWQ; Meyer, Miller, Metzger, & Borkovec, 1990) is a 16-item measure of frequency and intensity of worry. Each item is rated on a 5-point Likert-type scale, with higher scores indicating greater worry. The PSWQ was selected for analysis as it is one of the most widely used measures in studies that use an outcome measure for worry or anxiety symptoms.
The term “Penn State Worry Inventory” was searched in four separate databases (ERIC, Health Source, Medline and PsychINFO) for studies published from 1990 through 2014, resulting in 261 possible sources. Of the 261 possible sources, a total of 53 studies were excluded from analysis due to not having the full text available in English (47), not including an administration of the PSWQ (5), and one dissertation that was unable to be obtained. Therefore, 208 studies were evaluated for whether they reported a reliability coefficient for their use of the PSWQ. A total of 47,555 participants were represented in these studies, with widespread use in countries outside of the U.S. including Turkey, South Korea, Argentina and the Netherlands.
A first coder assessed the 208 studies to sort them into one of four categories. In the first category, nearly half of studies (50.5 percent, n = 105) provided a Cronbach's alpha reliability coefficient for their sample; these studies were included in final analyses to assess how different variables may impact reliability scores. The second category (23.2 percent, n = 61) included studies that made no mention of reliability. A third category was comprised of studies who referred to the PSWQ as a “reliable” test instrument (14.8 percent, n = 39). Lastly, a limited number of studies in the fourth category (3 percent, n = 1.1 percent) cited a reliability coefficient from a previous administration of the PSWQ without providing a reliability coefficient for their own sample.
A coding sheet was created to assess variables of interest for studies that provided reliability scores for the administration of the PSWQ in their sample; please see Table 1 for a summary of the characteristics coded in this study. Each article was re-coded blind by a second coder to ensure accuracy of data. Any discrepant coding was discussed until a consensus could be reached.
Reliability of the PSWQ scores ranged from a Cronbach's alpha of .60 to .99 with a mean of .89 and a standard deviation of .07 across the 158 reliability coefficients reported from a total of 105 studies. It is recommended for studies to report reliability coefficients separately for subgroups within a sample, such as different age groups or for biological sex (Rexrode, Petersen, & O'Toole, 2008). An acceptable level of internal consistency are values equal to or exceeding .80 (Thompson, 2003). In the present meta-analytic review of all published reliability coefficients for the PSWQ only 8 percent ( n = 13) of Cronbach's alpha values were below a value of .80. Therefore, the majority of the reported reliability coefficients were in an acceptable to excellent range.
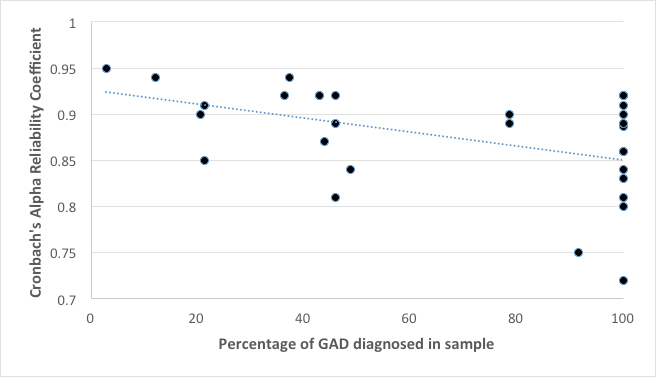
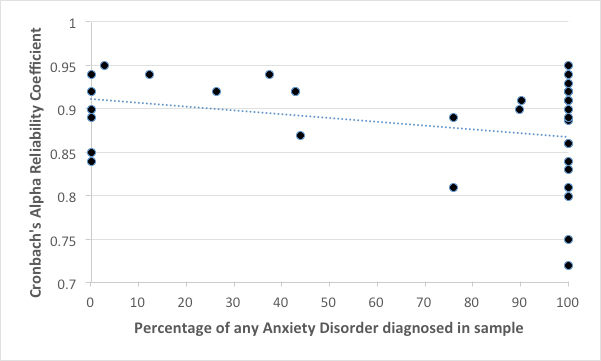
Bivariate correlations were performed to assess the relationship of reliability scores with the percentage of sample respondents with a diagnosis of Generalized Anxiety Disorder (GAD) and any anxiety disorder (see figures 1 and 2); both of these correlations were statistically significant. Percentage of GAD diagnoses in a sample was negatively correlated with reliability ( r (31) = -.40, p = .021). Further, percentage of any anxiety disorder in a sample was also negatively correlated with reliability ( r (37) = -.39, p = .017). We had anticipated a positive correlation between reliability coefficients and percentage of GAD or any anxiety disorder diagnosis in a sample, as the PSWQ was developed to assess symptoms associated with worry. The respondents in this type of sample would theoretically be more likely to experience the symptoms of pervasive worry that are the central focus of the PSWQ. However, a sample of respondents diagnosed with GAD is also more likely to have a more limited range in response (i.e., endorsing a higher intensity of worry for most test items). Our results of a negative correlation between reliability coefficients and percentage of GAD or any anxiety disorder diagnosis in a sample are likely due to lack of variation in responses in samples where some or most of the participants are diagnosed with an anxiety disorder, as a restricted range in responses typically results in a lower reliability coefficient (Vaz, Flkmer, Passmore, Parsons, & Andreou, 2013).
Independent samples t -tests were performed to assess the impact of the ethnicity (i.e., predominately Caucasian versus predominately non-Caucasian) and education level (i.e., a high school education or less versus some college or more) on reliability scores of the PSWQ. Neither t -test demonstrated significance.
Samples with any percentage of respondents diagnosed with GAD or any anxiety disorder were both negatively correlated with reliability coefficients produced by the PSWQ. These results are likely due to lack of variation in responses by participants who are formally diagnosed with an anxiety disorder (i.e., responding “very typical” to test items such as “I worry all the time”). Overall, the PSWQ appears appropriate for continued widespread use as reliability scores produced by this measure are predominately in an acceptable to excellent range. It is recommended that researchers continue to report Cronbach's alpha reliability estimates for their samples, thus contributing to a growing body of research that assists clinicians and researchers to choose instruments that are well-suited for their clients or sample populations.
Table 1. Coding Variables
Author's Note: This paper is in heartfelt memory of Siobhan K. O'Toole, PhD.
Meyer, T. J., Miller, M. L., Metzger, R. L., & Borkovec, T. D. (1990). Development and validation of the Penn State Worry Questionnaire. Behaviour Research and Therapy,28 (6), 487-495.
Rexrode, K. R., Petersen, S., & O'Toole, S. (2008). The ways of coping scale: A reliability generalization study. Educational and Psychological Measurement,68 (2), 262-280.
Thompson, B. (2003). Score reliability: Contemporary thinking on reliability issues. Thousand Oaks, CA: SAGE.
Vacha-Haase, T. (1998). Reliability generalization: Exploring variance in measurement error affecting score reliability across studies. Educational and Psychological Measurement,58 (1), 6-20.
Vaz, S., Falkmer, T., Passmore, A. E., Parsons, R., & Andreou, P. (2013). The case for using the repeatability coefficient when calculating test-retest reliability. PLoS One,8 (9), e73990.
Wilkinson, L., & the APA Task Force on Statistical Inference. (1999). Statistical methods in psychology journals: Guidelines and explanations. American Psychologist,54 (8), 594-604.